The 28th of November 2025 was truly a landmark day. Hearts are full, and minds are brimming with possibilities. We are joyful – not only because of the success of the event, but because we witnessed science in action, partnerships bearing fruit, and the promise of real impact on the lives of Cabo Verdeans.
At the Instituto Nacional de Saúde Pública (INSP), in collaboration with the Instituto Nacional de Meteorologia e Geofísica (INMG) and with the support of LuxDev, the preliminary results of the study “Temperature and Public Health in Cabo Verde” were unveiled to the most relevant sectors and the civil society. And this is not just another research project, it is a pioneering effort to understand how climate extremes, particularly heatwaves, affect public health in this island nation.
- Why This Study Matters
Cabo Verde, as a Small Island Developing State (SIDS), is disproportionately vulnerable to climate change. Despite low greenhouse gas emissions, the country faces severe environmental and institutional challenges, including prolonged droughts and rising temperatures. Since 1990, the average temperature has increased by 0.04°C per year, with projections indicating a rise of up to 3°C by the end of the century.
This study responds to an urgent need: to identify the health risks associated with extreme temperatures and to develop adaptive strategies that protect the most vulnerable such as children, the elderly, pregnant women, chronic diseases, outdoor workers, and low-income communities.
This is particularly relevant for Cabo Verde once the impacts of heat waves on public health are not yeat known. We can use The association between heatwaves and risk of hospitalization in Brazil: A nationwide time series study between 2000 and 2015 study to infeer the danger people are at, namly children and elders. Looking at Figure1 the associations between twelve heatwaves definitions and risk of all-cause hospitalizations in Brazil from 2000 to 2015, according to the percentile used to define the extreme heat event and the duration of it in days, we can see that even with a relatively short duration like two days a significante number of clhidren (0 to four and 5 to 9 years) and elerdly (more thatn wighty years old, are hospitalized 4% of the population. This risk increases significantly with the duration of the event.
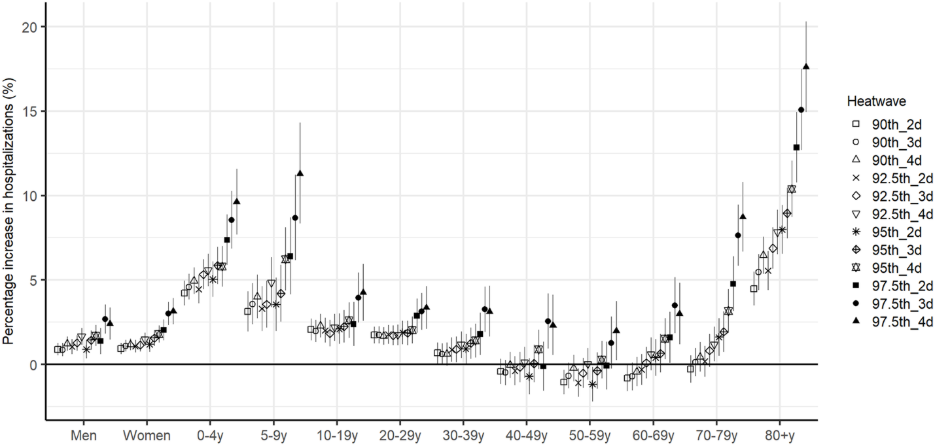
Figure 1 – Associations between heatwaves (12 definitions) and risk of all-cause hospitalization by sex and age.
Source: https://journals.plos.org/plosmedicine/article?id=10.1371/journal.pmed.1002753
- Scientific Innovation Supporting Decision-Making
The workshop showcased how science can directly inform public policy and improve daily life. Using climatological data from the past 30 years and health indicators, researchers developed localized criteria for identifying heatwaves.
- Objectives of the Study
The study aims to:
- Define what constitutes a heatwave in Cabo Verde using local climate data;
- Identify meteorological thresholds that trigger health risks;
- Develop thermal comfort indices and early warning systems;
- Expand meteorological data collection networks;
- Create public alert platforms and protection strategies; and
- Support evidence-based climate adaptation policies in the health sector.
- Preliminary Results and Next Steps
The results presented yesterday include:
- Historical mapping of heatwaves in Sal, Mindelo, and Praia;
- Identification of seasonal patterns and severity levels (Figure 2);
- Development of a regional forecasting model (WRF) with 3 km resolution (Figure 3); and
- Initial simulations of heatwave alerts and thermal comfort indicators.
One example of identifying seasonal patterns and severity levels is illustrated in Figure 2. This figure shows the October heatwave (highlighted in red lines) and its classification as an extreme public health hazard, based on the Heat Index,a metric that combines temperature and humidity (represented by the purple dot).
Figure 3 compares two different indicators: heat stress (left map) and heat index (right map). The key difference lies in the inclusion of humidity in the heat index calculation, which provides a more accurate representation of perceived heat and associated health risks.
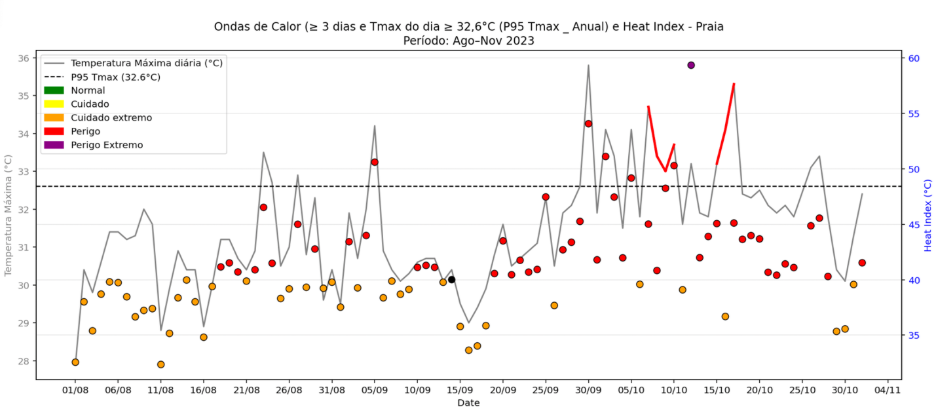
Figure 2 – Characterization of the heatwaves in Praia.
Source: Nilton Évora do Rosário, INMG: Temperatura e Saúde Pública em Cabo Verde – Ondas de calor em Cabo Verde: critérios, análise histórica e estratégias de previsão.
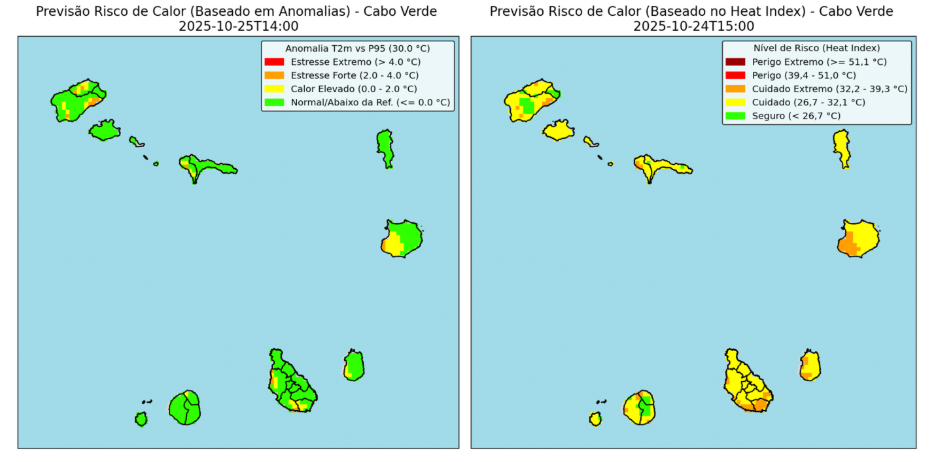
Figure 3 – Prevision of heat indicators for daily simulations with a 3 km resoluiton.
Source: Nilton Évora do Rosário, INMG: Temperatura e Saúde Pública em Cabo VerdeOndas de calor em Cabo Verde: critérios, análise histórica e estratégias de previsão.
- Next Steps and the Vision for a Resilient Cabo Verde
The next phase involves integrating health data to validate these models, doing the reanalysis of the data series to go back to 1940, and collaborating with the National Institute for the Management of the Territory (INGT) to integrate this information in the climate risk and vulnerability maps, along with the definition of alerts to the population. These tools will enable targeted interventions and public awareness campaigns, especially during peak heat seasons.
This initiative is part of the broader Climate Action Programme, aligned with Cabo Verde’s updated Nationally Determined Contribution (NDC) and National Adaptation Plan (NAP). It exemplifies how interdisciplinary collaboration between meteorology, public health, and civil protection an lead to smarter, more resilient systems.
We didn’t just share data we built hope. Hope that through science, innovation, and cooperation, we can build a healthier, more climate-resilient Cabo Verde. The journey continues, and we invite all stakeholders, researchers, policymakers, and citizens to walk this path with us.
Science is not just about understanding the world it’s about changing it. And yesterday, we took a step forward.